How Power BI Can Transform Your Business in 2025

The year is fast approaching 2025. The business landscape is more dynamic, competitive, and data-saturated than ever before. Gut feelings and historical spreadsheets, while once the backbone of decision-making, are no longer sufficient to navigate the complexities of the modern market. Businesses, whether nimble Small to Medium-sized Businesses (SMBs) or sprawling Enterprises, are grappling with an ever-increasing deluge of data from diverse sources: CRM systems, ERP platforms, social media, IoT devices, financial records, and countless other operational databases.
The challenge isn’t the lack of data; it’s the overwhelming abundance of it and the difficulty in extracting timely, actionable intelligence. How do you cut through the noise? How do you transform raw, disparate data points into a clear, cohesive narrative that drives growth, efficiency, and innovation?
Microsoft Power BI:
For Data Analysts striving to deliver deeper insights, Department Managers seeking to optimize team performance, Executives demanding a clear view of the entire organization, and business leaders exploring robust dashboarding and data reporting tools – Power BI stands out as a transformative solution. This isn’t just another analytics tool; it’s a comprehensive Business Intelligence (BI) platform poised to redefine how your organization leverages data in 2025 and beyond.
This article will explore how Power BI can fundamentally transform your business, moving you from data paralysis to data-driven dynamism. We’ll delve into its core capabilities, explore compelling use cases across various departments, and look ahead to why Power BI is an indispensable asset for thriving in the data-centric future of 2025.
The Data Deluge and the Business Imperative: Why BI is Non-Negotiable
Before diving into Power BI specifically, let’s acknowledge the environment we’re operating in. By 2025, global data creation is projected to exceed 180 zettabytes. That’s an astronomical figure, and a significant portion of that data will reside within businesses like yours.
Without a robust BI strategy, this data can become:
-
- A Burden: Siloed, inaccessible, and difficult to manage.
- A Blind Spot: Leading to missed opportunities, inefficiencies, and uninformed decisions.
- A Risk: Poor data quality or security can lead to compliance issues and reputational damage.
Conversely, businesses that harness their data effectively gain a significant competitive edge. They can:
-
- Understand customer behavior with unprecedented clarity.
- Optimize operations for maximum efficiency and cost savings.
- Identify emerging market trends and pivot quickly.
- Forecast future performance with greater accuracy.
- Empower employees at all levels to make informed decisions.
This is where Business Intelligence, and specifically Power BI, comes into play. It’s no longer a luxury for large corporations; it’s a fundamental necessity for survival and growth for businesses of all sizes.
What is Power BI? More Than Just Pretty Charts
At its core, Power BI is a collection of software services, apps, and connectors that work together to turn your unrelated sources of data into coherent, visually immersive, and interactive insights. It’s designed to be accessible, allowing users from business analysts to executives to create their own reports and dashboards without heavy reliance on IT.
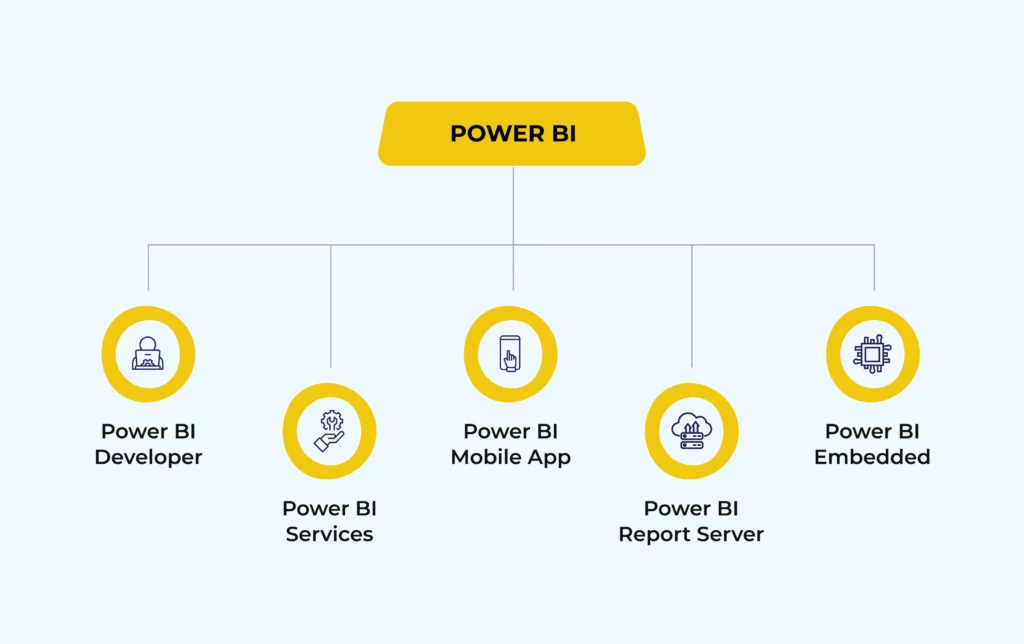
Key Components of the Power BI Ecosystem:
-
- Power BI Desktop: A free Windows application you install on your local computer. It’s the primary tool for connecting to data, transforming and modeling it, and creating rich, interactive reports with visualizations.
- Power BI Service (PowerBI.com): A cloud-based SaaS (Software as a Service) offering. This is where you publish reports from Power BI Desktop, create dashboards, share insights, and collaborate with colleagues.
- Power BI Mobile Apps: Native apps for Windows, iOS, and Android devices, allowing you to securely access and interact with your reports and dashboards on the go.
- Power BI Report Server: An on-premises solution for organizations that need to keep their data and reports behind their firewall. It allows publishing Power BI reports (and traditional paginated reports) locally.
- Power BI Embedded: Allows developers to embed Power BI visuals, reports, and dashboards directly into their own applications, websites, or portals, providing a seamless user experience.
Core Capabilities that Drive Transformation:
-
- Extensive Data Connectivity: Power BI can connect to hundreds of data sources, both on-premises and in the cloud – from simple Excel files and databases like SQL Server, Oracle, and MySQL, to cloud services like Salesforce, Google Analytics, Azure SQL Database, and SharePoint.
- Powerful Data Preparation (Power Query): Integrated within Power BI Desktop, Power Query allows users to clean, shape, transform, and combine data from multiple sources with an intuitive interface, significantly reducing the time spent on data wrangling.
- Robust Data Modeling: Create relationships between different data tables, define calculated columns and measures using Data Analysis Expressions (DAX), and build sophisticated data models that form the foundation for insightful analysis.
- Rich, Interactive Visualizations: Go beyond static charts. Power BI offers a vast library of built-in and custom visuals that allow you to tell compelling data stories. Drill down, slice and dice, and interact with your data to uncover hidden patterns.
- Seamless Sharing and Collaboration: Publish reports to the Power BI service, create dashboards that provide a consolidated view of key metrics, and share them securely with colleagues, controlling access and permissions.
- AI-Powered Insights: Leverage built-in AI capabilities like Q&A (ask questions in natural language), Quick Insights (automatically find patterns), and integrations with Azure Machine Learning to uncover deeper, predictive insights.
The Transformative Power: How Power BI Reshapes Your Business in 2025
Understanding what Power BI is sets the stage. Now, let’s explore how it can transform your business operations, strategy, and culture by 2025.
-
-
Democratizing Data & Fostering a Data-Driven Culture:
Power BI breaks down data silos. No longer is data analysis the exclusive domain of specialized IT teams or data scientists. Its user-friendly interface empowers business users across departments – from marketing and sales to finance and HR – to access, analyze, and visualize data relevant to their roles.
- Transformation: When everyone has access to the right data at the right time, decision-making becomes more informed, agile, and decentralized. This fosters a culture where data isn’t just reported; it’s actively used to drive daily actions and strategic initiatives. By 2025, this self-service BI capability will be crucial for responsive business operations.
-
Unveiling Actionable Insights (Not Just Data):
Raw data is just noise. Power BI excels at transforming this noise into actionable insights. Interactive dashboards allow users to drill down into specifics, filter by various dimensions, and see the impact of different variables.
- Transformation: Instead of “What happened?”, your teams can answer “Why did it happen?” and, crucially, “What should we do next?”. For example, a sales manager can quickly identify underperforming regions or products and investigate the root causes directly within their dashboard, leading to targeted interventions.
-
Enhanced Operational Efficiency & Cost Reduction:
By visualizing operational data, businesses can pinpoint bottlenecks, inefficiencies, and areas for improvement. Whether it’s optimizing supply chains, streamlining manufacturing processes, or improving resource allocation, Power BI provides the clarity needed.
- Transformation: Imagine identifying that a particular machine in your production line is consistently causing delays, or that a specific marketing channel has a disproportionately high cost-per-acquisition. Power BI surfaces these issues, enabling data-backed decisions to optimize processes, reduce waste, and ultimately lower operational costs – a key competitive advantage in 2025.
-
Improved Sales & Marketing Performance:
Sales teams can track KPIs like sales targets, conversion rates, and pipeline health in real-time. Marketing departments can monitor campaign performance, customer segmentation, website analytics, and social media engagement, all in one place.
- Transformation: Sales managers can identify top performers and coach others, or pinpoint deals at risk. Marketers can understand which campaigns are delivering the best ROI, optimize ad spend, and gain deeper insights into customer preferences to personalize messaging and improve engagement. This leads to more effective resource allocation and higher conversion rates.
-
Optimized Financial Planning & Analysis (FP&A):
Finance teams can leverage Power BI to automate financial reporting, conduct variance analysis, create dynamic P&L statements, balance sheets, and cash flow forecasts. The ability to connect to various financial systems provides a consolidated view of financial health.
- Transformation: Tedious manual report generation is replaced by automated, real-time dashboards. This frees up finance professionals to focus on strategic analysis, scenario modeling, and providing forward-looking guidance to the business, rather than just reporting historical figures. Accuracy and speed in financial reporting will be table stakes by 2025.
-
Streamlined HR & Talent Management:
HR departments can use Power BI for workforce analytics – tracking recruitment funnels, employee turnover rates, training effectiveness, compensation benchmarks, and diversity & inclusion metrics.
- Transformation: Gain insights into why employees leave, identify skill gaps, optimize recruitment processes, and ensure fair compensation. A data-driven approach to HR helps attract, retain, and develop top talent, which is critical for any business aiming to thrive.
-
Elevated Customer Experience (CX):
By integrating data from CRM, support tickets, surveys, and social media, businesses can build a 360-degree view of their customers. Analyze customer satisfaction (CSAT), Net Promoter Score (NPS), churn rates, and support resolution times.
- Transformation: Understand customer pain points, identify opportunities to improve service, and personalize interactions. A better understanding of the customer journey allows for proactive interventions and strategies to enhance loyalty and reduce churn, directly impacting the bottom line.
-
Proactive Risk Management & Compliance:
Power BI can help identify anomalies, outliers, and patterns that might indicate potential risks, fraud, or compliance breaches. Custom alerts can be set up for critical thresholds.
- Transformation: Move from reactive damage control to proactive risk mitigation. For instance, financial institutions can monitor transactions for suspicious activity, or manufacturing companies can track quality control metrics to prevent defects.
-
Power BI in Action: Real-World Use Cases Across Departments
Let’s make this even more tangible by looking at how different roles and departments can leverage Power BI:
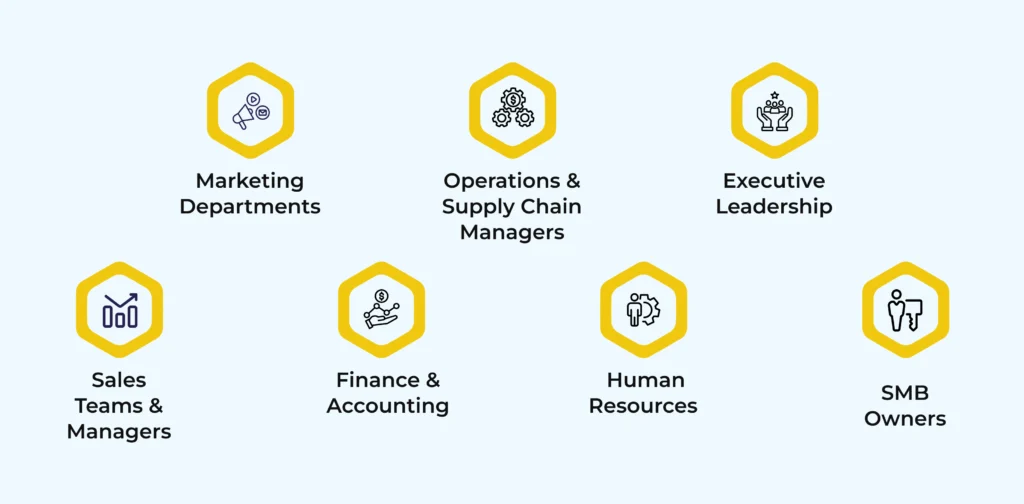
- For Sales Teams & Managers:
- Dashboard: Real-time sales performance vs. targets, pipeline by stage, lead conversion rates, sales cycle length, top-performing reps/products/regions.
- Impact: Identify bottlenecks in the sales funnel, forecast revenue more accurately, optimize sales strategies, and motivate the team with transparent performance tracking.
- For Marketing Departments:
- Dashboard: Campaign ROI, website traffic & engagement (sessions, bounce rate, time on page), social media analytics (reach, engagement, sentiment), lead generation by channel, customer acquisition cost (CAC).
- Impact: Optimize marketing spend, understand content effectiveness, refine targeting for campaigns, and demonstrate marketing’s contribution to revenue.
- For Finance & Accounting:
- Dashboard: Profit & Loss statements, balance sheets, cash flow analysis, budget vs. actuals, accounts receivable/payable aging, key financial ratios.
- Impact: Faster month-end closing, improved financial forecasting, better cash flow management, and enhanced visibility into the company’s financial health for strategic decision-making.
- For Operations & Supply Chain Managers:
- Dashboard: Inventory levels, order fulfillment rates, production efficiency (OEE), supplier performance, logistics costs, quality control metrics.
- Impact: Reduce stockouts or overstocking, improve on-time delivery, identify production bottlenecks, optimize supplier relationships, and lower operational costs.
- For Human Resources:
- Dashboard: Employee headcount & demographics, turnover rates (by department, tenure, etc.), recruitment pipeline status, training completion rates, employee satisfaction scores, compensation analysis.
- Impact: Identify retention issues, improve hiring efficiency, measure the impact of HR initiatives, and ensure equitable compensation practices.
- For Executive Leadership (CEOs, CFOs, COOs):
- Dashboard: High-level KPIs across all departments (overall revenue, profitability, market share, customer satisfaction, operational efficiency), progress against strategic goals.
- Impact: A holistic, real-time view of business performance, enabling quick identification of strategic opportunities or threats, facilitating data-backed strategic planning, and improving communication with stakeholders.
- For SMB Owners:
- Dashboard: A consolidated view of crucial metrics from sales, marketing, finance, and operations, tailored to their specific business model. Often, SMBs benefit from combining data from QuickBooks, Google Analytics, and a simple sales CRM.
- Impact: Empowers SMB owners, who often wear multiple hats, to make informed decisions quickly without needing a large analytics team. Power BI’s affordability and scalability make it highly suitable for growing businesses.
Why Power BI in 2025? The Evolving Landscape & Future-Proofing Your Business
The relevance of Power BI is only set to increase as we move towards 2025, driven by several key trends:
-
-
AI and Machine Learning Integration Deepens:
Microsoft is heavily investing in AI, and Power BI is a prime beneficiary. Features like “Copilot” in Power BI (allowing users to create reports and get insights using natural language prompts), automated insights, anomaly detection, and seamless integration with Azure AI services will become even more sophisticated. This means more predictive and prescriptive analytics, accessible to a broader range of users. In 2025, AI won’t just be a feature; it will be an embedded assistant in your analytics workflow.
-
Cloud-Native Scalability and Collaboration:
As businesses generate more data and require more complex analyses, the cloud-native architecture of Power BI Service ensures scalability and performance. Real-time collaboration, data sharing, and centralized governance are inherently supported, which is crucial for hybrid and remote work models that will persist and evolve by 2025.
-
Real-Time Data Streaming Becomes Mainstream:
The demand for instant insights from streaming data (e.g., IoT devices, website clickstreams, social media feeds) is growing. Power BI’s capabilities for handling real-time data will enable businesses to react instantaneously to changing conditions, from adjusting manufacturing processes on the fly to personalizing customer offers in real-time.
-
Increased Emphasis on Data Governance and Security:
With growing data volumes and stricter regulations (like GDPR, CCPA), robust data governance and security are paramount. Power BI, especially within the Microsoft ecosystem, offers comprehensive features for data lineage, sensitivity labeling (via Microsoft Information Protection), row-level security, and access control, helping businesses manage their data responsibly. This will be non-negotiable by 2025.
-
The Rise of the “Citizen Data Analyst”:
Power BI empowers individuals who are not traditional data analysts but possess strong domain expertise to perform their own data analysis. This “democratization of data” means insights can be generated closer to where business decisions are made, leading to faster and more relevant actions. The ease of use and intuitive interface of Power BI are key enablers of this trend, which will be in full swing by 2025.
-
Getting Started with Power BI: Your Roadmap to Transformation
Embarking on your Power BI journey doesn’t have to be daunting. Here’s a practical roadmap:
-
- Define Your Goals & KPIs: What business questions do you need to answer? What key performance indicators (KPIs) matter most to your success? Start with a clear business objective.
- Identify Key Data Sources: Where does the data you need reside? Excel files, databases, cloud applications? Power BI can connect to a vast array.
- Start Small, Scale Up: Don’t try to boil the ocean. Begin with a specific department or a single, high-impact use case. Build a pilot project, demonstrate value, and then expand.
- Invest in Training & Skill Development: While Power BI is user-friendly, providing training for key users will accelerate adoption and maximize its potential. Microsoft offers extensive free learning resources.
- Foster Collaboration & Build a Community: Encourage sharing of reports and dashboards. Create a center of excellence or a user group to share best practices and learnings.
- Prioritize Data Quality: Garbage in, garbage out. Ensure your source data is clean, accurate, and reliable. Power Query within Power BI can help significantly with data cleansing.
- Iterate and Refine: Your first dashboards won’t be perfect. Gather feedback from users, learn what works, and continuously improve your reports and data models.
Overcoming Potential Hurdles on Your Power BI Journey
While the benefits are immense, it’s wise to be aware of potential challenges:
-
- Data Quality: The insights from Power BI are only as good as the underlying data. Invest time in data cleansing and establishing data governance practices.
- Change Management: Adopting any new tool requires a shift in processes and mindset. Communicate the benefits clearly, provide training, and champion its use from leadership.
- Skill Gaps: While Power BI is designed for business users, some foundational understanding of data concepts, DAX (for more complex calculations), and data modeling can be beneficial for advanced users. Plan for upskilling.
- Choosing the Right Licensing: Power BI offers different licensing options (Free, Pro, Premium Per User, Premium Per Capacity). Understand your needs in terms of features, data volumes, and sharing requirements to select the most cost-effective option.
Addressing these proactively will smooth your path to successful Power BI implementation and adoption.
The Power BI Advantage: Your Competitive Edge in 2025
In an era where data is the new currency, Power BI equips your business with the tools to not just manage this currency, but to invest it wisely for maximum returns. By 2025, the ability to rapidly analyze data, extract actionable insights, and disseminate them across the organization will be a defining characteristic of successful businesses.
Power BI offers a compelling combination of:
-
- Power and Sophistication: For complex data modeling and advanced analytics.
- Ease of Use: For broad adoption by business users.
- Affordability and Scalability: Suitable for SMBs and large enterprises alike.
- Seamless Integration: Within the Microsoft ecosystem (Azure, Office 365, Dynamics 365) and with hundreds of other data sources.
- Continuous Innovation: Microsoft consistently updates Power BI with new features and capabilities, particularly in AI and usability.
 Conclusion:
The question is no longer if you should leverage business intelligence, but how effectively you can do it. As we look towards 2025, Power BI stands out as a pivotal technology that can transform raw data into your most valuable strategic asset. It empowers your teams, streamlines your operations, deepens customer understanding, and ultimately drives smarter, faster, and more impactful decisions.
For SMB owners seeking to punch above their weight, Enterprise Leaders aiming for comprehensive oversight, Data Analysts wanting to deliver more profound insights, and Department Managers striving for peak team performance – Power BI offers a pathway to unlock unprecedented levels of business performance.
The future of business is data-driven. Is your organization ready to lead the charge? Explore Power BI today and start your transformation journey. The insights that will shape your success in 2025 are waiting to be discovered within your data.